Durham’s rental market is fast-paced, with properties leasing in as little as 8 days. For landlords, pricing missteps can lead to costly vacancies, while accurate rent setting ensures steady income and long-term returns. Here’s how data analytics is transforming rental strategies in Durham:
- Median Rent (May 2026): $1,655 (up 0.8% YoY).
- Key Drivers: Job growth (6,600 new jobs in 2025), population increase (1.9% in 2025), and high mortgage rates (6.36%) pushing more people to rent.
- Vacancy Trends: Multifamily vacancy peaked at 11.1% in 2025 due to new construction but is stabilizing in 2026.
- Neighborhood Variations: Rents range from $1,135 in Northeast Durham to $2,511 in West Village.
Landlords are using real-time data to optimize rents, reduce vacancies, and adapt to tenant demand. Platforms like Zillow, RentHub, and local tools such as the Durham Housing Dashboard provide insights into pricing, demand, and market trends. By tracking metrics like days on market, occupancy rates, and renewal trends, landlords can make informed decisions to stay competitive in this dynamic market.
Durham’s Rental Market at a Glance
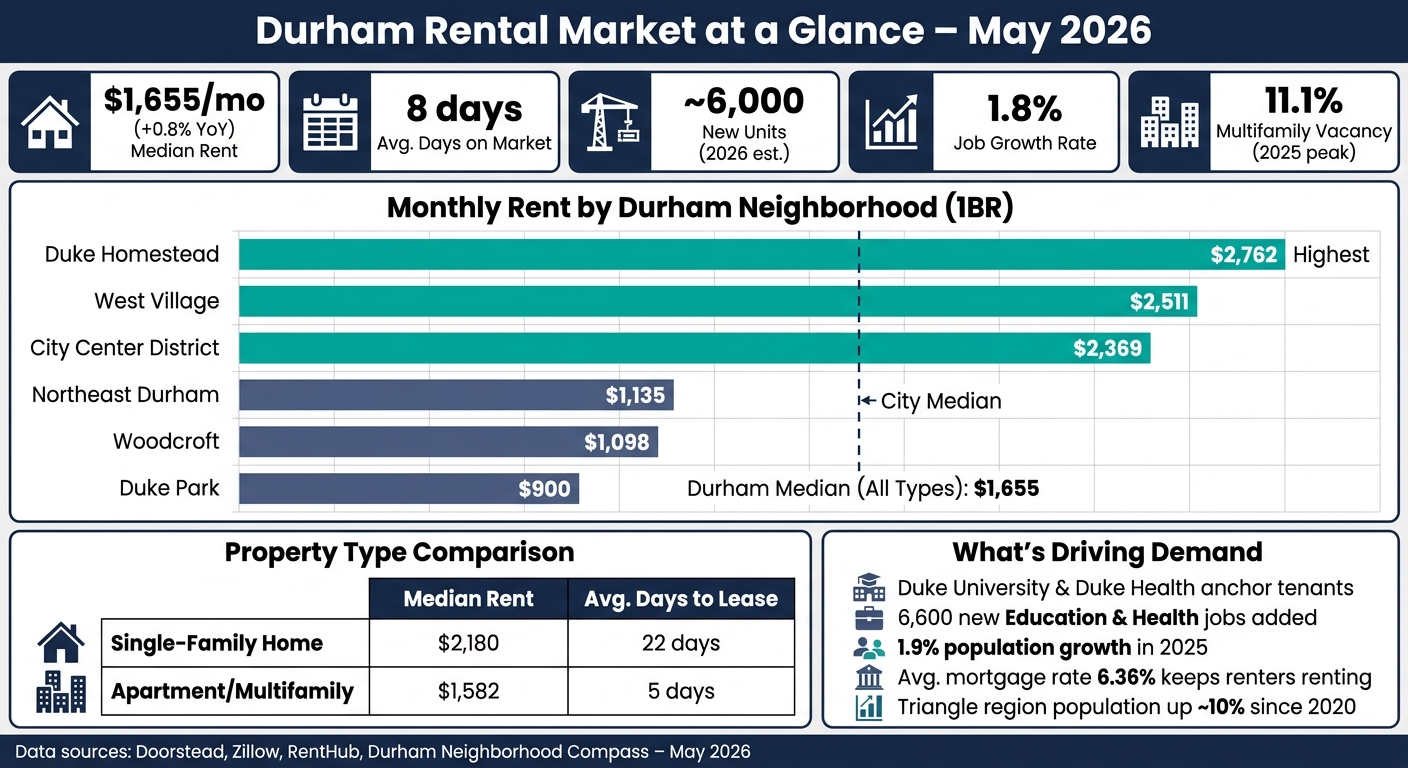
Durham Rental Market by Neighborhood: Rents, Occupancy & Leasing Speed (2026)
Key Metrics to Know About Durham Rentals
Durham’s rental market has leveled off after a period of intense growth, requiring landlords to adopt thoughtful pricing strategies.
As of May 2026, the median rent across all property types stands at $1,655, reflecting a modest year-over-year increase of 0.8%. On a monthly basis, rents rose by 1.0% in May, signaling a period of stabilization after the challenges faced in 2025.
A significant factor in last year’s market dynamics was the addition of 2,960 new apartments, which pushed the multifamily vacancy rate to 11.1% in 2025. However, 2026 is seeing a slowdown in new construction, with about 6,000 units expected to be completed, suggesting a more balanced supply in the near term.
Rental prices vary widely depending on the neighborhood. For example, in West Village, a one-bedroom unit averages $2,511 per month, while areas like Northeast Durham and Hope Valley offer rents below $1,200. This stark difference – amounting to nearly $17,000 annually – is shaping both renter behavior and landlord strategies.
| Submarket / Metric | Value (May 2026) |
|---|---|
| Durham Median Rent (All Types) | $1,655 |
| 2-Bedroom Median | $1,769 |
| 3-Bedroom Median | $2,222 |
| West Village (1BR) | $2,511 |
| City Center District (1BR) | $2,369 |
| Northeast Durham (1BR) | $1,135 |
| East Durham Occupancy Rate | 95.7% |
| Avg. Days on Market | 8 days |
These numbers paint a clear picture of the current market and help explain the factors driving demand.
What Drives Tenant Demand in Durham
Durham’s rental market benefits from the steady demand created by its key institutions – Duke University, Duke Health, and the Research Triangle Park (RTP). These anchors ensure a consistent flow of students, faculty, medical staff, and researchers, providing a reliable tenant base even during economic slowdowns.
The Education and Health Services sector recently added 6,600 jobs to the region, boosting demand in areas like Trinity Park and University Hill. This growth has prompted targeted developments, such as Crescent Communities‘ 400-unit Novel UHill and The Spectrum Cos.’ 267-unit Vara Trinity Park, both designed to cater to this expanding population.
Durham’s job market is growing at a rate of 1.8%, while the city’s population increased by 1.9% in 2025. Across the broader Triangle region, population growth since 2020 has reached nearly 10%, ensuring a deep pool of renters even as new housing supply comes online.
Another key factor driving demand is the current mortgage rate environment. With rates averaging 6.36%, many would-be homebuyers are finding it difficult to enter the housing market, leaving renting as their primary option. As The Doorstead Team explains:
"The metro keeps pulling people in faster than it can house them… Buying isn’t a realistic exit from renting for most newcomers." – The Doorstead Team
This dynamic has created both opportunities and challenges for landlords, who must balance accurate pricing with maintaining competitive, appealing properties through professional property management in Durham to attract this growing pool of renters.
sbb-itb-aa27f6d
Where to Find Data on Durham’s Rental Market
Accurate predictions in the rental market rely heavily on high-quality data. This information can come from national platforms, local government resources, and detailed portfolio reports.
Platforms for Rent Pricing and Inventory Data
Zillow Rentals provides a snapshot of Durham’s rental market, showing the average rent across all property types at $1,900, with 1,152 units currently listed as of May 18, 2026. Zillow also evaluates renter demand, currently labeling Durham as a "COOL" market. This classification helps landlords understand how quickly they might lease available units.
For more localized insights, Doorstead offers monthly reports covering median rents, days on market, and occupancy rates for the Raleigh-Durham metro area. Their data highlights how quickly units are being rented, noting that vacancies exceeding 8–11 days could indicate pricing issues.
RentHub dives deeper with ZIP code-level rent trends, maps of median rents, and rent-per-square-foot details, all derived from millions of data points. For hyper-local insights, the Durham Neighborhood Compass is an excellent resource. It provides census tract-level information, including rent data, housing violations, and eviction statistics and prevention. For context, Durham County’s average rent across all census tracts was $1,415 in 2023, offering a useful baseline for comparing past and present market conditions.
Beyond pricing, incorporating economic and demographic data can further refine your understanding of market trends.
Local Economic and Demographic Data Sources
To fully grasp rental trends, it’s essential to consider the broader economic and demographic context. The Durham Housing Dashboard – a collaboration between the City of Durham, Durham County, and Durham Public Schools – stands out as a comprehensive resource. It covers topics like housing supply, rental affordability, job growth, and demographic changes. The "Compare Places" tool is particularly helpful, allowing users to benchmark specific Durham neighborhoods against regional and national averages.
The U.S. Census Bureau‘s American Community Survey (ACS) is another valuable resource, offering neighborhood-level data such as gross rent as a percentage of household income. This metric is crucial, as 49.6% of Durham County renters are considered cost-burdened, spending more than 30% of their income on housing. In areas with high cost-burden rates, tenants may be more sensitive to rent increases, a factor landlords should consider before making pricing decisions. However, keep in mind that ACS data is based on 5-year rolling averages, making it better suited for analyzing long-term trends rather than short-term fluctuations.
Portfolio Data from Unicorn Rentals
While public platforms provide a broad view of the market, portfolio data from Unicorn Rentals offers property-specific insights. Their proprietary tools allow landlords to monitor Net Operating Income (NOI) over time, revealing seasonal revenue patterns unique to their Durham properties. Additionally, rent collection metrics can act as an early warning system for tenant financial strain, often signaling economic shifts before they appear in public data.
Another useful feature is their maintenance coordination logs, which track repair frequency and costs. This data helps landlords anticipate future capital expenses and identify properties where deferred maintenance might be causing tenant turnover. By comparing this internal data with city-wide benchmarks – like East Durham’s 95.7% occupancy rate – landlords can better evaluate their portfolio’s performance relative to the broader market.
How to Build a Rental Forecast Framework for Durham
Turning raw data into a reliable forecasting process doesn’t require fancy tools or a background in data science. What matters most is consistency and focusing on the right details.
Step 1: Define Your Target Segments
Before diving into numbers, clearly outline the segment of Durham’s rental market you’re analyzing. This is a critical step for landlords across the cities we serve. The city’s rental landscape is diverse – consider how different a 4-bedroom single-family home in Trinity Park is from a 1-bedroom apartment in East Durham. These differences show up in pricing too: single-family homes in the Raleigh-Durham metro have a median rent of $2,180, while apartments average $1,582. To get accurate insights, narrow your focus by neighborhood, property type, and bedroom count. For instance, 3-bedroom units in Durham currently average $2,050 and are often highly sought after by landlords. If your properties are near Duke University or cater to medical professionals, factor in these demographics – they’re key drivers in Durham’s rental market.
Step 2: Track the Right Metrics Over Time
Keep an eye on metrics like Days on Market (DOM) and median rent trends to spot shifts early. If a property stays on the market longer than usual, it’s often a pricing issue, not necessarily a lack of demand. Alongside DOM, monitor month-over-month rent changes. For example, in May 2026, Durham’s median rent increased by 1.0%, even as the broader metro area saw a slight slowdown. Supply trends also matter – new completions in the Raleigh-Durham area are expected to drop to about 6,000 units in 2026, down from 12,000 in 2025. This reduced supply could help stabilize or even slightly boost rents.
Step 3: Implement Basic Analytics
You don’t need advanced tools to uncover trends. A simple 3-month moving average can smooth out seasonal fluctuations and give you a clearer picture of how the market is performing – especially as peak leasing season approaches (spring through early summer). For example, Durham’s average rent remained steady between January and May 2026, hovering between $1,875 and $1,895. Pair this with year-over-year comparisons to distinguish short-term blips from lasting trends. The rent softening in 2025, for instance, was tied to a surge in supply rather than a drop in demand.
Don’t overlook renewal rates by property segment. A dip in renewals can signal problems like rent hikes that outpace market norms or unresolved maintenance issues. Spotting these warning signs early can help you address them proactively, avoiding costly vacancies down the line.
With this framework, landlords can transform data into actionable insights for smarter rental decisions.
Turning Data Into Rental Decisions
Use your forecasting framework to make informed decisions about rent pricing, tenant demand, and property investments. By relying on your defined metrics, you can transform raw data into actionable strategies for rentals and investments.
How to Set Competitive Rent Prices
Pricing rentals effectively means combining rent comparables with leasing speed data. For instance, in Durham, properties typically lease within 8 days. If a property remains vacant for more than 8–10 days, it’s a sign to revisit your pricing strategy – not your marketing approach.
Local neighborhood data is just as crucial as city-wide averages. For example, a 1-bedroom unit in Duke Homestead rents for $2,762, while the same type of unit in Duke Park averages just $900. Overlooking these submarket differences can lead to lost revenue or pricing errors.
"Benchmarking replaces guesswork with clarity. Using KPIs helps landlords understand why properties perform differently, spot issues early, and make confident decisions about pricing, expenses, and growth." – Mark Thomas Properties PM
Tracking how rent increases impact renewal rates is another key factor. If renewals drop after a price adjustment, it’s often a sign that the new rate exceeds what the local market can support. These insights can also guide predictions about tenant demand in Durham.
How to Forecast Tenant Demand in Durham
Tenant demand varies significantly across Durham. For example, East Durham boasts a 95.7% occupancy rate, one of the highest in the metro area, making it a reliable choice for steady rental income. Meanwhile, neighborhoods near Duke University, such as Trinity Park and Ninth Street, benefit from a steady flow of students, faculty, and healthcare workers connected to Duke Health.
Employment trends also offer valuable clues about demand. The Education and Health Services sector added 6,600 jobs to the metro area, while Durham’s job growth rate of 1.8% is more than double the national average. With the supply of new units slowing to 6,000 by 2026, down from 12,000 in 2025, demand is expected to remain strong. These insights are essential for making strategic property investments, as detailed below.
Using Data to Plan Property Investments
Data-driven insights about pricing and tenant demand can also inform smarter investment decisions. For example, consider the trade-offs between property types: single-family homes in the Raleigh-Durham metro rent for a median of $2,180 but take an average of 22 days to lease. In contrast, apartments rent for $1,582 and lease in just 5 days. If consistent cash flow is your priority, multifamily units offer quicker leasing. However, single-family homes in the right neighborhoods can command higher rents per unit.
Neighborhood rent gaps can also guide renovation plans. For instance, Woodcroft has an average rent of $1,098, well below the city-wide average of roughly $1,900. Targeted upgrades, like modernized kitchens, in-unit laundry, or energy-efficient systems, can help close this gap and justify higher rents. Keep an eye on repair cost metrics to identify aging systems early, and focus on upgrades that directly boost rent potential rather than purely cosmetic changes.
Conclusion: Why Durham Landlords Should Use Data Analytics
Durham’s rental market isn’t just competitive – it’s lightning fast. With units renting out in as little as 8 days and new completions projected to drop to around 6,000 by 2026, relying solely on gut instinct just won’t cut it anymore. This is where data analytics steps in, transforming market trends into clear, actionable strategies. It’s this kind of clarity that can shape every smart decision.
Consistency is the secret weapon. Whether you’re pricing a 2-bedroom unit, scouting neighborhoods for your next investment, or timing your listing to hit the spring leasing rush, data provides a reliable, repeatable framework. Robin Young, Senior Researcher at Buildium, captured Durham’s potential perfectly: "Durham may still appeal to investors who take a longer‑term view, as its underlying fundamentals point to sustained demand in the years ahead."
But data analytics isn’t just about setting rents. It can help minimize tenant turnover, cut maintenance costs, and reduce vacancy time using proven marketing channels that bring in the best applicants. These aren’t just small wins – they directly impact your bottom line. Lower vacancy rates, better cash flow, and improved net operating income are all within reach when your decisions are guided by data.
For landlords looking for a hands-off approach, Unicorn Rentals offers property management services across Durham and the Triangle. Their plans, starting at 10% of monthly rent, include financial reporting, property inspections, and portfolio-level data tracking. It’s a streamlined way to gain insights without adding extra work to your plate.
Durham’s market fundamentals remain strong, and landlords who embrace data-driven strategies are the ones most likely to thrive in this fast-moving landscape.
FAQs
What data should I track weekly to predict rent changes in my Durham neighborhood?
To predict rent trends in Durham, it’s essential to monitor key weekly metrics such as vacancy rates and average days on market. These figures provide a clear picture of rental demand in the area. For instance, neighborhoods with stable occupancy rates around 95% often indicate a healthy potential for rental growth.
Additionally, keeping tabs on new construction announcements and permit filings can help you stay ahead of potential supply changes that might impact the market. If you’re looking for assistance, Unicorn Rentals offers property management services designed to help landlords analyze these trends and make informed decisions.
How do I know if my rent is too high based on days on market and occupancy?
To figure out if you’re charging too much for rent, start by comparing your property’s days on market and occupancy rates to local averages. For example, in high-demand areas of Durham, rentals typically get leased within just 8 days. If your property sits vacant for longer periods or has frequent tenant turnover, it might be a sign that your rent is higher than what the market supports. On the other hand, steady occupancy levels often indicate that your pricing is on target.
For landlords looking to fine-tune their pricing strategies, Unicorn Rentals offers tools to analyze these trends and make informed adjustments.
How can I forecast tenant demand near Duke, RTP, and Downtown Durham using local job and supply data?
To gauge tenant demand around Duke, RTP, and Downtown Durham, keep an eye on employment trends and housing supply data. When employers like Duke Health or companies in RTP expand, it often points to increased rental demand. Pay attention to new construction completions – a limited housing supply can push rental prices higher. Additionally, high occupancy rates and strong lease renewal numbers are clear indicators of demand. Focus your marketing efforts between April and August, as this is when university hiring and relocations are at their busiest.
Related Blog Posts
- Raleigh & Durham Rental Market 2026: Trends, Rent Forecasts, and What It Means for Landlords
- How Much Should You Charge for Rent in Raleigh, Durham & Chapel Hill in 2026 (By Bedroom & Neighborhood)
- How to Use Dynamic Pricing in Durham Rentals
- Extended Stay / Mid-Term Rentals vs Short-Term (Airbnb) vs Long-Term Rentals: Profitability in the Raleigh–Durham Triangle, NC