

Yes – but only if the numbers still work at today’s value. In 2026, Triangle rentals can still make sense, but flat rents, more vacant units, and higher taxes, insurance, and repair bills have cut into margin.
If I were sizing up a rental in Raleigh–Durham today, I’d keep it simple:
- Check monthly cash flow, not just gross rent
- Budget for vacancy, because one empty month can wipe out 8.3% of yearly rent
- Use current costs, including taxes, insurance, repairs, and reserves
- Compare by submarket and property type, not metro averages
- Decide honestly whether I should hold, fix the weak spots, bring in Raleigh property management, or sell
A few numbers shape the whole call:
- Durham–Chapel Hill apartment vacancy hit 11.7% by Q3 2024
- Metro occupancy was about 93.1% by mid-2026
- Raleigh single-family rentals average about $1,995/month
- Raleigh apartments sit closer to $1,559–$1,564/month
- Management fees often run 8%–12%
- Many owners now budget 8%–12% of rent for maintenance
- A solid hold usually means positive cash flow and DSCR of 1.20+
Here’s the short version: this is no longer an easy market where weak pricing or slow repairs get ignored. If I owned a rental here, I’d judge it on three things: cash flow, risk, and time drain.
| Decision | When it makes sense | Main downside |
|---|---|---|
| Hold | Cash flow is still positive after all costs | Costs may keep climbing faster than rent |
| Improve | The unit is underperforming due to pricing, listing, or leasing issues | Upfront spend and short lease-up risk |
| Hire management | The property works, but time and compliance are a problem | Fee cuts monthly margin |
| Sell | Cash flow stays negative or big repairs are coming | Taxes, sale costs, and lost future upside |
If I had to boil the article down to one test, it would be this: Would I still buy this property today at its current value and expected rent? If the answer is no, it may be time to change how I run it – or let it go.
The 2026 Triangle Rental Market: Rents, Demand, and Vacancy Risk
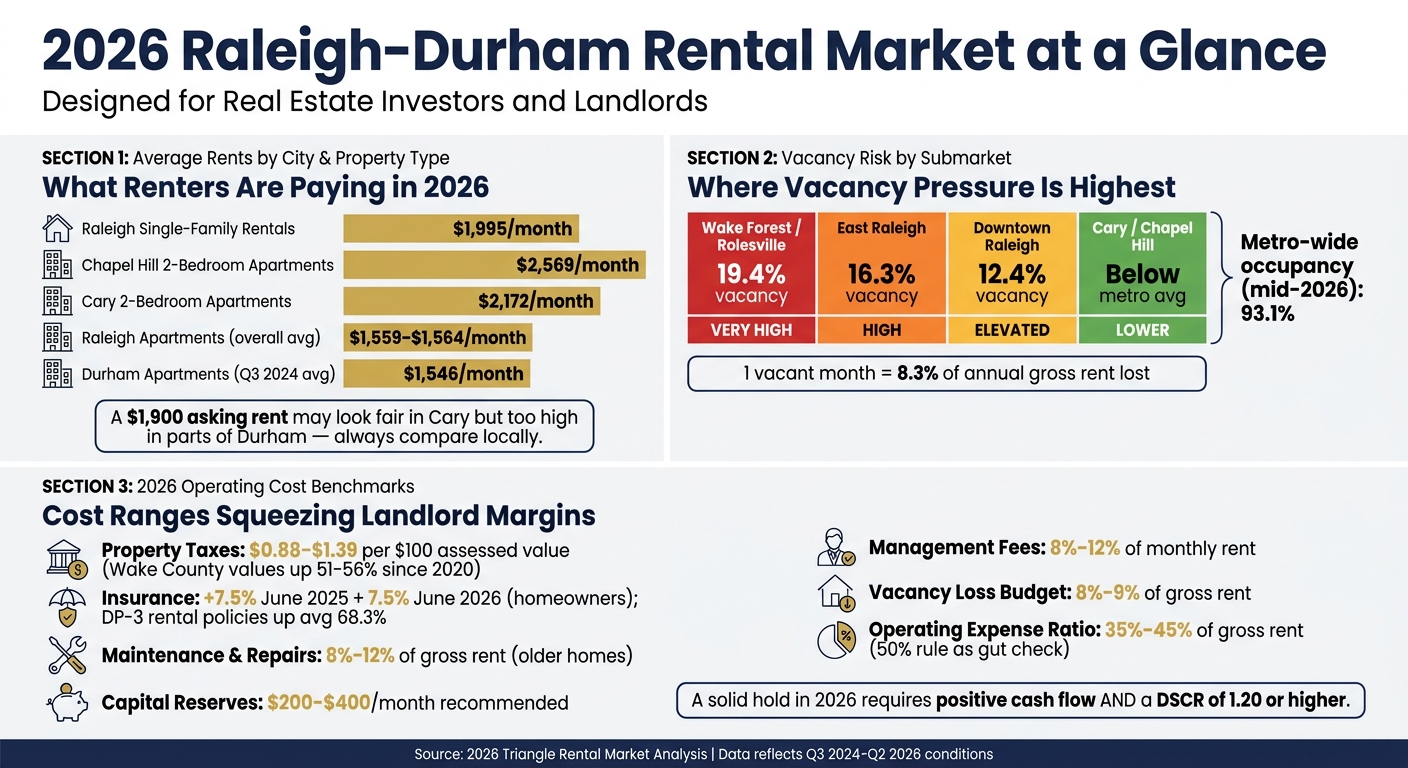
2026 Raleigh-Durham Rental Market: Key Numbers Every Landlord Must Know
The Triangle is not one market. Raleigh, Durham, Cary, and Chapel Hill each play by different rules when it comes to rent, vacancy, and renter demand. If you rely on a market-wide average, it’s easy to price a rental the wrong way and get a shaky read on profit.
How Rents and Leasing Speed Differ by City and Property Type
The gap between property types is hard to ignore. Single-family rentals in Raleigh average about $1,995 per month, while multifamily apartments are closer to $1,559–$1,564. Townhomes and condos usually fall somewhere in the middle, depending on location and interior upgrades.
But higher rent doesn’t always mean an easier win. Larger single-family homes and 3-bedroom units saw rent drops of 14%–22% in late 2025 before partly settling down in Q2 2026. So yes, the top end is higher, but it can swing more.
Leasing speed tells a similar story. Well-priced rentals near major employers can lease in about 9–11 days. Bigger homes with aggressive pricing tend to sit on the market longer.
City differences matter just as much as property type. Cary 2-bedroom apartments average around $2,172, Chapel Hill 2-bedrooms average about $2,569, Durham apartments averaged $1,546 in Q3 2024, and Raleigh’s overall apartment average sits near $1,579. That means a $1,900 asking rent may look fair in Cary but too high in parts of Durham. The takeaway is simple: compare your unit to nearby properties of the same type, not to a Triangle average that mixes very different places.
And there’s the catch. A high asking rent means little if the area already has too many empty units.
Where Vacancy Risk Is Growing in 2026
Vacancy risk is not spread evenly across the Triangle. Wake Forest/Rolesville hit 19.4% apartment vacancy, East Raleigh reached 16.3%, and Downtown Raleigh came in at 12.4%. By mid-2026, metro occupancy was around 93.1%, but those same areas still faced higher vacancy and rent concessions.
Seasonality makes this even more important. Demand tends to peak from March through July, when families move before the school year and university-linked renters change places. A turnover in November through February leaves you fishing in a smaller renter pool, and units often sit longer.
That delay gets expensive fast. One vacant month wipes out about 8.3% of annual gross rent, and that’s before re-leasing costs. In plain English: pricing a unit well and timing a lease the right way can make or break the year.
| Submarket | Vacancy Pressure | Key Driver |
|---|---|---|
| Wake Forest / Rolesville | Very High (19.4%) | New apartment oversupply |
| East Raleigh | High (16.3%) | New construction concentration |
| Downtown Raleigh | Elevated (12.4%) | New supply competition |
| Cary / Chapel Hill | Lower | Supply-constrained, strong demand |
Use these rent and vacancy differences at the local level to test whether a property still clears break-even after taxes, insurance, repairs, and financing. The next step is to measure whether those rents cover actual operating costs.
sbb-itb-aa27f6d
Run the Numbers: Income, Costs, and Break-Even
A Basic Cash Flow Model for a Raleigh–Durham Rental
Start with gross scheduled rent. That’s what the property would bring in if it stayed rented for all 12 months at the full market rate.
Next, subtract vacancy and credit loss. That gives you effective gross income. After that, subtract all operating costs: property taxes, insurance, HOA dues, maintenance, repairs, turnover, capital reserves, owner-paid utilities, and property management if you use it. What’s left is NOI.
Then subtract mortgage debt service from NOI to get cash flow.
This part matters more than many buyers expect. Two rentals can show the same $18,000 NOI and still perform very differently. With a 3% loan, the property might clear $300 per month. With a 7% loan, that same deal could land at negative $100 per month.
The 2026 Cost Categories Squeezing Landlord Margins
Use 2026 expense assumptions. If you plug in 2025 numbers, there’s a good chance the deal looks better on paper than it will in your bank account.
Property taxes are the first big pressure point. Wake County’s 2024 revaluation pushed assessed values up by about 51%–56% compared with 2020. Across Wake County, combined county-and-city tax rates usually fall between $0.88 and $1.11 per $100 of assessed value. In parts of Durham, Chapel Hill, and Orange County, that figure tends to run between $1.17 and $1.39 per $100.
Even if a revenue-neutral rate is in place, a 41.5%+ jump in value can still push your tax bill higher. A simple way to plan for that: take your latest bill and model at least a 3%–5% annual increase. That matters even more because Wake County is moving to a shorter revaluation cycle – every three years in 2027, then every two years starting in 2029.
Insurance is the other major strain. North Carolina regulators approved homeowners’ insurance rate increases of 7.5% in June 2025 and another 7.5% in June 2026. There’s also a separate filing for rental dwelling policies, or DP-3, with an average 68.3% increase, split into 28.5% on July 1, 2026 and 30.9% on July 1, 2027.
That adds up fast. A policy that costs $1,600 per year can climb to about $1,849 after two 7.5% hikes, and that’s before any rental-dwelling policy increase kicks in. In practice, use current quotes and add a 10%–15% buffer.
Maintenance and repairs also need a heavier line item than many older pro formas show. Since 2020, labor and materials costs have climbed enough that many owners who once used 5%–7% of rent for maintenance now budget 8%–12%, especially for older homes.
For turnover, plan on about one month of rent per turn for cleaning, paint, touch-ups, and re-leasing. On top of that, set aside $200–$400 per month in capital reserves for roofs, HVAC systems, appliances, and other big-ticket items. That buffer can save you from scrambling for high-interest debt when something breaks at the worst time.
Across North Carolina, rental properties often run at an operating expense ratio of 35%–45% of gross rent. The 50% rule is still a good gut check. If your deal looks much better than that, go back and stress-test your numbers. A spreadsheet can be flattering if the assumptions are too light.
Comparison Table: Which Line Items Change Profitability Fastest
| Line Item | Typical 2026 Triangle Range | Effect on Annual Cash Flow | Risk if Underestimated |
|---|---|---|---|
| Rent | About $1,361–$1,500/mo on average in the Raleigh metro | Main source of income | If you project too high, vacancy can stretch out and cash flow can turn negative |
| Vacancy | About 8%–9% of gross rent | Cuts income right away | A property that looks fine on paper can go negative in a single bad month |
| Property Taxes | $0.88–$1.39 per $100 assessed value (county + city) | Large fixed cost that tends to rise after revaluation | Reassessments can add hundreds of dollars per year to ownership costs |
| Insurance | Depends heavily on carrier; budget above your current quote and add a 10%–15% buffer | Medium to high cost that is moving up fast | If you budget too low, premiums can outrun rent growth and leave you exposed |
| Maintenance & Repairs | 8%–12% of gross rent for many older properties | Varies, but often hits older homes harder | Older budget rules can miss the current labor and materials market |
| Capital Reserves | $200–$400/month | Drags near-term cash flow but protects long-term finances | Skipping reserves often leads to debt when the roof or HVAC fails |
| Management Fees | 8%–12% of monthly rent | Predictable percentage expense | Poor self-management can cost more through vacancy, mistakes, and legal risk |
These figures cover operating costs only. Local rules, loan terms, and day-to-day management can still swing the result.
The Hidden Problems: Compliance, Management Burden, and Asset Risk
Strong rent numbers can still fall apart if compliance issues, turnover, or simple management mistakes eat into margin. On paper, a rental may look fine. In practice, one legal slip or eviction error, one slow re-lease, or one bad repair decision can push the deal in the wrong direction. The first hidden cost is regulation.
North Carolina and Local Rules That Affect the Bottom Line
North Carolina puts limits on several income items that many investors assume they can control more freely. Late fees are capped at the greater of $15 or 5% of monthly rent, and only after rent is five days late. That puts a ceiling on fee income and adds timing risk, which can hit break-even harder than many owners expect.
Other rules matter too. Deposit deadlines, trust-account rules, and local housing inspections can add compliance risk, slow down re-leasing, and increase repair costs. If the owner is handling leasing, maintenance, and paperwork alone, the pressure gets heavier fast. A rule missed on Monday can turn into a cost problem by Friday.
When Self-Managing Costs More Than It Saves
Self-management can take 5 to 10+ hours per week during vacancy and turnover. That time adds up fast. And the bigger issue isn’t just time. It’s error.
A small pricing mistake, a delayed showing, or a legal misstep can wipe out a full year of management-fee savings. That’s the part many owners miss. Saving on fees sounds good until one avoidable mistake costs more than the fee ever would.
If self-management pushes the property below break-even, the whole ownership decision starts to look different. That’s why management structure can affect actual return just as much as rent or taxes.
Comparison Table: Self-Manage vs. Unicorn Rentals

| Aspect | Self-Managed | With Unicorn Rentals |
|---|---|---|
| Time Commitment | High – 5–10+ hours per week during leasing and turnover periods | Low – reviewing monthly reports |
| Vacancy Control | Variable – depends on the owner’s availability and marketing skill | Optimized – professional pricing, marketing, and leasing speed |
| Tenant Screening | Manual – higher risk of missed red flags | Multi-point credit, criminal, and eviction checks |
| Compliance Support | Owner’s responsibility to track North Carolina Chapter 42 and local codes | NC-specific legal expertise |
| Maintenance Coordination | DIY or retail-rate contractors; reactive to problems | Maintenance coordination with vetted vendors |
| Reporting | Manual – spreadsheets and receipts | Automated – monthly financial reports |
| Emergency Response | Owner’s personal phone at 3 a.m. | Professional 24/7 response |
| Owner Risk Exposure | High – personal liability for legal and compliance errors | Low – standardized processes, documentation, and professional oversight |
Professional management matters more now because Triangle rentals aren’t easy enough to shrug off missed rent, slow leasing, or code problems. For many owners, this isn’t just a choice between doing it yourself and paying a fee. It’s a choice between protecting cash flow and letting avoidable friction chip away at it.
Decision Paths for 2026: Hold, Improve, Hire Management, or Sell
With cash flow, taxes, insurance, and compliance already mapped out, the next step is simple: pick the least expensive path for each property.
When Holding the Property Still Makes Sense
Hold the property only if cash flow stays positive after vacancy, reserves, taxes, insurance, and debt service. A DSCR of 1.20 or higher is a good target. The property should also need only routine upkeep to stay competitive and should not eat up too much owner time.
When Better Execution Is the Smarter Move
If a property is hovering near break-even, the issue may not be the property itself. It may be execution.
In many cases, a few basic fixes can change the picture:
- Better listing quality
- More consistent screening standards
- Lower vacancy
That can push a thin-margin rental into workable territory. And if the property is sound but underperforming, professional management may help with pricing, screening, leasing speed, maintenance control, and compliance.
Comparison Table and Conclusion: Hold and Optimize vs. Sell Now
Use the table below to match each rental with the action that fits its cash flow and workload.
| Option | Main Financial Benefit | Main Risk | Best Fit For |
|---|---|---|---|
| Hold at Current Rent | Ongoing cash flow and appreciation without sale costs | Rising expenses outpace flat rent growth; margin narrows over time | Owners with positive cash flow, DSCR ≥ 1.20, and manageable operations |
| Raise Rent & Improve Operations | Higher effective rent and stronger asset position | Short-term vacancy during transition; upfront improvement costs | Properties priced below market or losing ground to newer competition |
| Hire Professional Management | Better leasing speed, compliance discipline, and expense control without selling | Management fee reduces gross margin | Owners with viable properties but limited time, expertise, or risk tolerance |
| Sell | Immediate equity access; eliminates operational and regulatory exposure | Capital gains taxes; loss of future Triangle appreciation | Owners with persistently negative cash flow, large upcoming capital needs, or low personal risk tolerance |
Triangle rentals can still work in 2026, but the easy-rent years are over. At this point, it comes down to property-level math, plain cost assumptions, and an honest look at how much time and attention you can give the asset.
The owners who do well now tend to treat rentals like a business. They run the numbers each year, stay current on North Carolina compliance, and use a management setup that fits what the property actually needs.
FAQs
How do I know if my rental still works at today’s value?
Check whether your rental still fits today’s market by looking at current performance, not old assumptions.
Start with NOI to see how much profit the property brings in after expenses. Then compare your vacancy rate and days on market against local averages.
It also helps to review:
- Renewals
- Your property-level profit and loss statement
- Your current rent roll
If renewals are dropping or vacancies are lasting longer, your rent may be off, or the property’s condition may need work.
What vacancy rate should I budget for in the Triangle in 2026?
Recent Triangle data points to a smart rule of thumb: budget for vacancy with Raleigh at about 7%. In some multifamily submarkets, vacancy climbed to 11.1% in 2025 before it started to level off. At the same time, average occupancy has hovered around 94% to 95%.
That matters because even a short stretch without a tenant can chip away at cash flow. And the hit doesn’t stop at lost rent. Turnover costs can run from $1,000 to $5,000 per unit, depending on cleaning, repairs, paint, and leasing work.
There’s one more number worth paying attention to: nearly 40% of properties see vacancies each year. That’s why it makes sense to keep a buffer in your budget. A little breathing room can go a long way toward protecting net operating income.
When should I hold, hire management, or sell?
It comes down to your goals, your time, and how much property you’re dealing with.
- Hold if you want long-term stability and you can keep up with preventive maintenance, lease renewals, and rent pricing.
- Hire management if day-to-day work, maintenance scheduling, tenant screening, or compliance starts to feel like too much.
- Sell if the property no longer lines up with your money goals, or if vacancies, repair costs, or big capital projects are putting pressure on cash flow.
Related Blog Posts
- Raleigh & Durham Rental Market 2026: Trends, Rent Forecasts, and What It Means for Landlords
- How Much Should You Charge for Rent in Raleigh, Durham & Chapel Hill in 2026 (By Bedroom & Neighborhood)
- Renting vs. Buying in the Triangle: A Complete Cost and Lifestyle Comparison for First-Timers
- Extended Stay / Mid-Term Rentals vs Short-Term (Airbnb) vs Long-Term Rentals: Profitability in the Raleigh–Durham Triangle, NC